Microbe ID: PMDBM199
Microbe Name: Enterococcus faecalis
Taxonomy Level: Species
NCBI Taxonomy ID:
1351
Taxonomy Genus: Enterococcus [1350]
Taxonomy Family: Enterococcaceae [81852]
| Substance Name | Substance Category | Substance Subcategory | Metabolism Type | Metabolites | Effects on Substance | Experimental System | Experimental Organism | Experimental Disease Condition | Alteration Mechanism | Alteration Outcome | Reference (PubMed ID) |
|---|
| Substance Name | Substance Category | Substance Subcategory | Substance Details | Effect on Microbe | Effect Strength | Experimental System | Experimental Organism | Experimental Disease Condition | Reference (PubMed ID) |
|---|
| Substance Name | Substance Category | Substance Subcategory | Substance Details | Effect on Microbe | Effect Strength | Experimental System | Experimental Organism | Experimental Disease Condition | Reference (PubMed ID) |
|---|
| Substance Name | Substance Category | Substance Subcategory | Metabolism Type | Metabolites | Effects on Substance | Experimental System | Experimental Organism | Experimental Disease Condition | Alteration Mechanism | Alteration Outcome | Reference (PubMed ID) |
|---|
| Substance Name | Substance Category | Substance Subcategory | Substance Details | Effect on Microbe | Effect Strength | Experimental System | Experimental Organism | Experimental Disease Condition | Reference (PubMed ID) |
|---|
| Microbiota Site | Disease Name | Disease Association Class | Disease Associated Abundence Change | Reference (PubMed ID) |
|---|
The substances in "Bacteria-Substance-Disease Interaction/Association network" only cover therapeutic drugs. The network is presented for an intuitive visualization of the drugs that interact with microbiota bacteria, diseases that associated with microbiota bacteria changes, and disease-drug interactions. The interactive network is generated using Cytoscape.js.

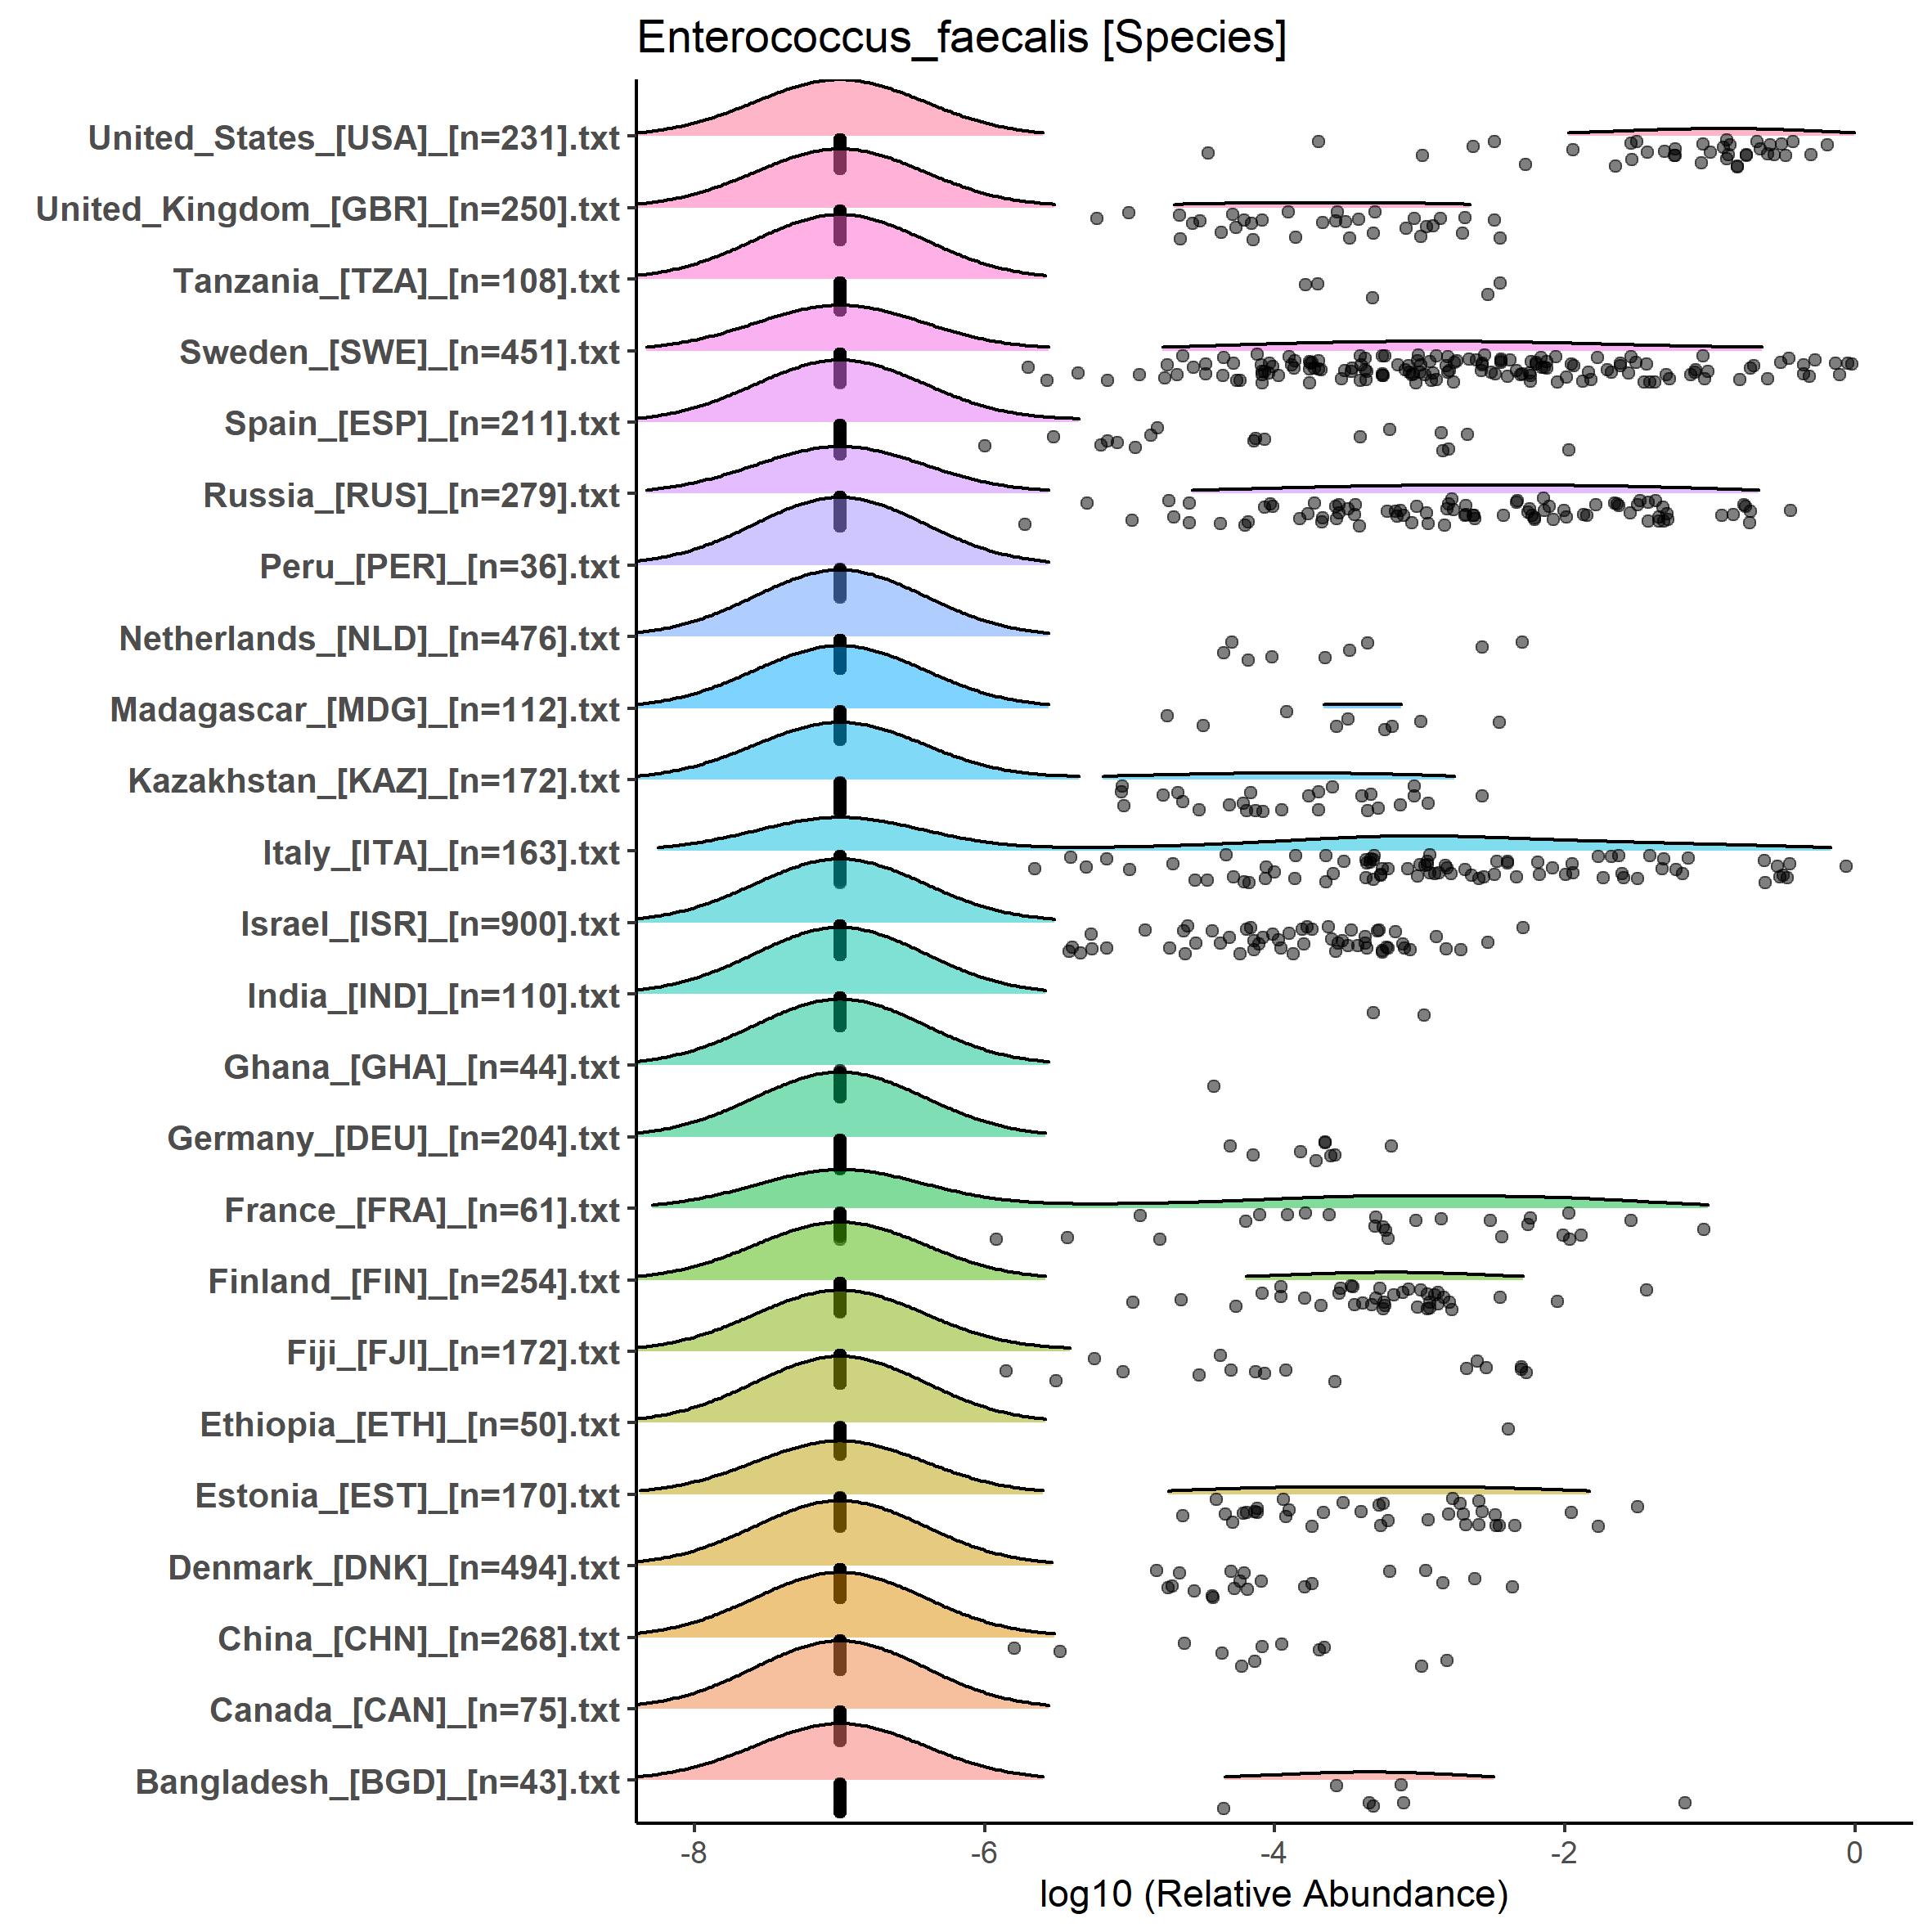
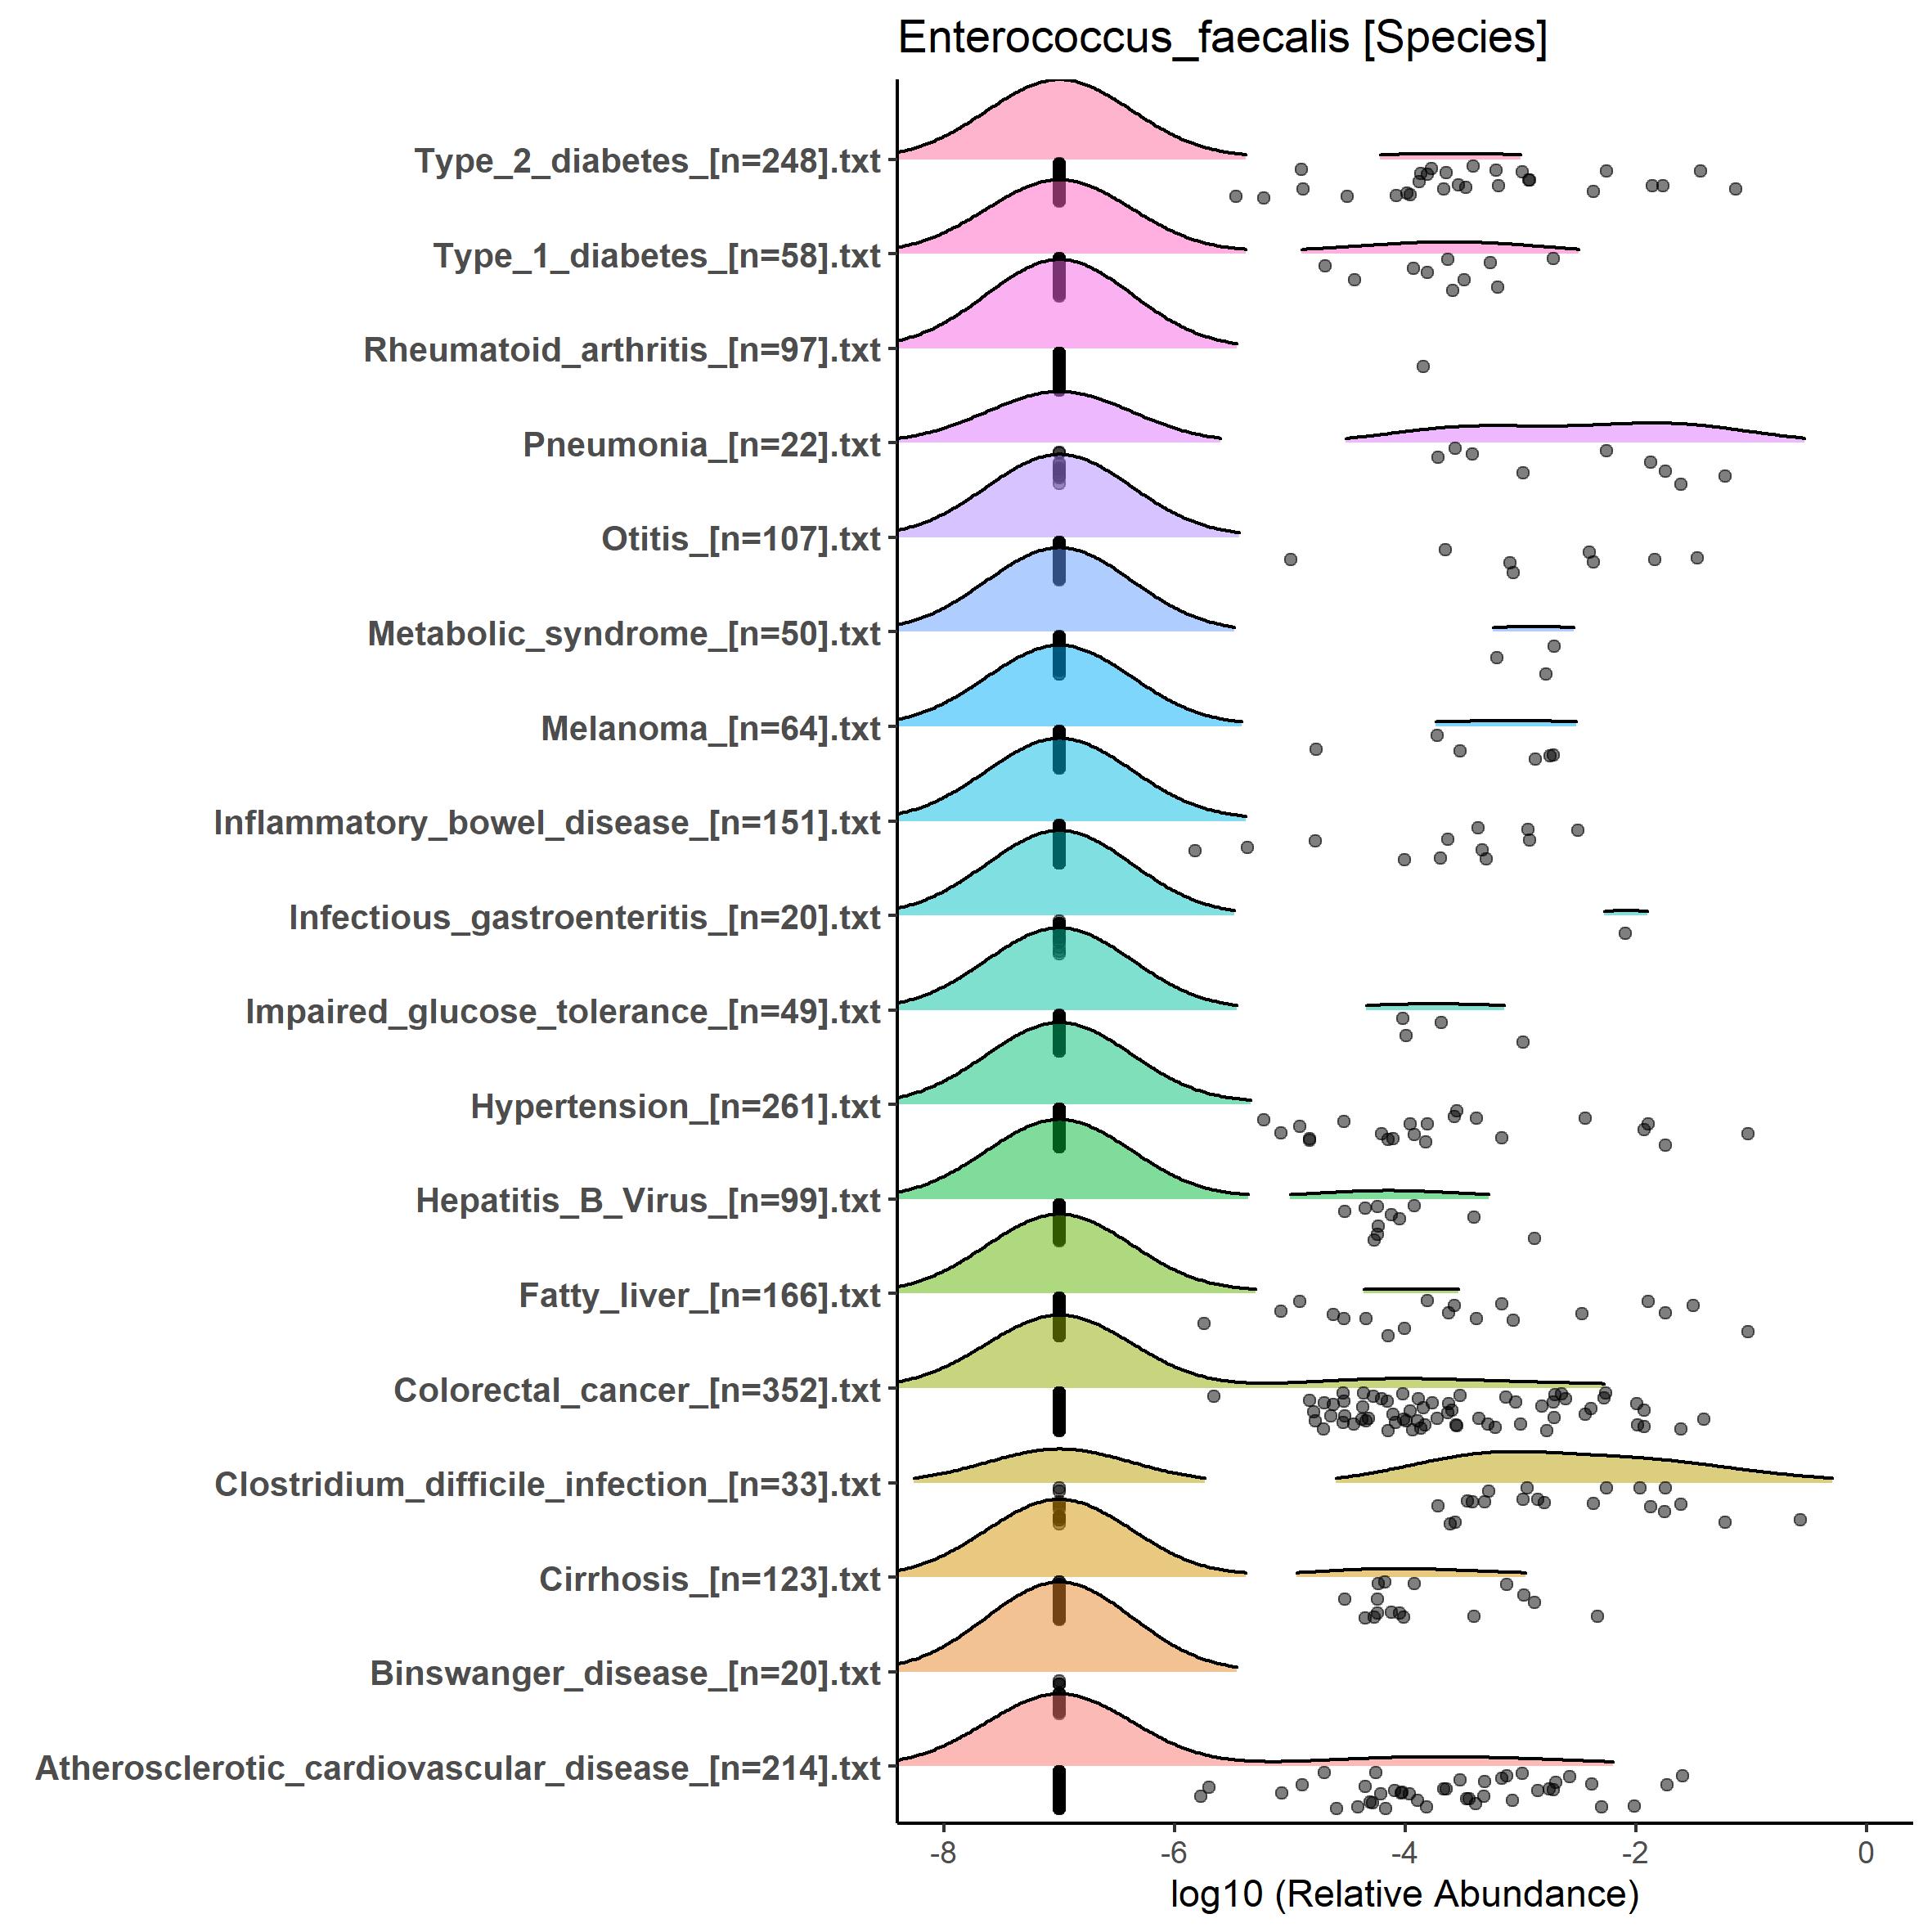
The relative taxonomical abundance data (pre-processed using a unified analysis pipeline) was retrieved from curatedMetagenomicData resource [Edoardo Pasolli, et al. Nat Methods. 2017;14(11):1023-1024]. Data retrieved here was pre-processed as unified relative abundance: at each taxonomic level (e.g., species, genus, family), the sum of microbial abundance of individual microbiota sample was 1, and relative abundance of each microbe was log10 transformed [relative abundance ranges from -7 to 0].
Healthy samples and disease samples (only disease types with >= 20 samples were included) were grouped by age periods, patients’ country, or disease type to plot the relative abundance landscape using ggplot2 R package.